Processing a new graph
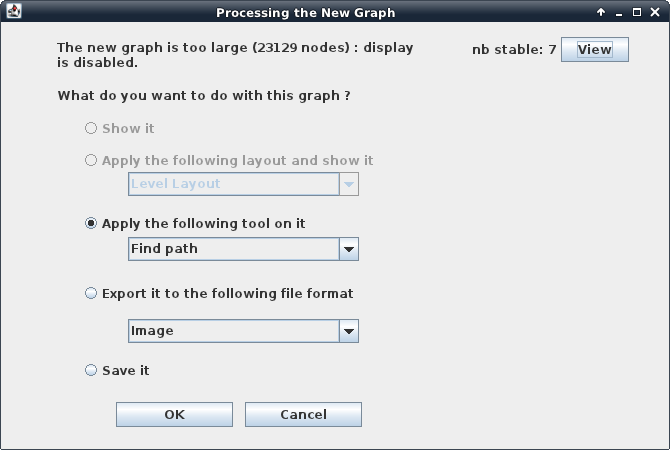
When a new graph is generated (for example after a simulation or after computing the graph of the strongly connected components), the user can choose to display it with the default layout, directly specify a layout on display, to select and apply one of the available tools, to save it or to export it to another format. The What to do dialog box allows to select among these possibilities.
For state transition graphs, the number of stable states appears at the top-right corner, which can be visualized by clicking on the "View" button.
Clicking on the OK button performs the selected action. This dialog box remains available to perform different actions on the graph. This dialog is closed when the graph is displayed, as all actions can then be performed through the Tools menu of the GINsim window.
Very small graphs will be opened directly in a new GINsim window with a simple layout.
