Animator for the State Transition Graphs
The STG animator
The animation tool is launched through the Animate option of the Action menu of a state transition graph. It allows to interactively follow a trajectory in the state transition graph. Genes of the regulatory graph are highlighted, to display the corresponding activity levels.
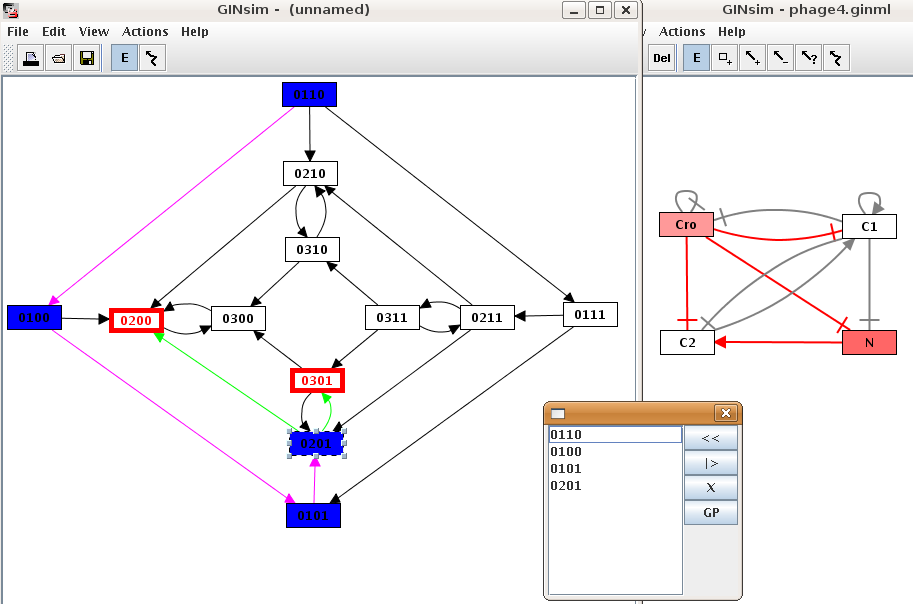
To follow a trajectory in the state transition graph, select a starting state. It is then colorized in blue and added to the trajectory (listed in the animation dialog box). Its successor states are highlited, and can be added to the trajectory upon selection, which in turns changes the available successor states.
To build another trajectory, select a state in the dialog and press the "<<" button to remove it and all of its successors.
To view the defined trajectory, select the starting state and press the "|>" button.
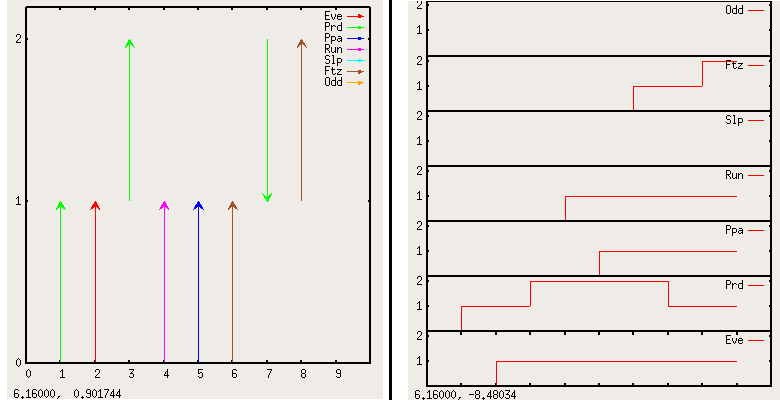
Trajectory visualisation with gnuplot
A path created with the animation plugin or found by the path finder can be visualized using gnuplot. The "GP" button (in the path finder and in the animator box) opens the gnuplot export box.
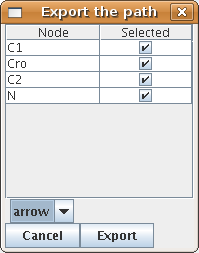
After selecting the kind of output and the genes to display, click "export" and choose a place to save the plot. Note that two files are created but only the first file name is prompted for. If this filename is "myplot.gnuplot", the second file will then be named "myplot.data". The actual graph can then be displayed using the command load "mygraph.gnuplot" at the gnuplot prompt.